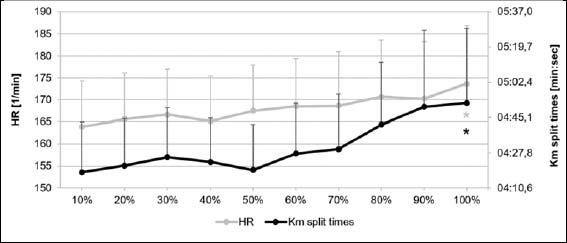
Figure 1.
Graphic view of HR and km split times over time (mean ± standard deviation).