 |
Figure 1.
Peak (A) and mean power outputs (B) during each sprint. Values are means ± standard error of the mean.
|
|
|
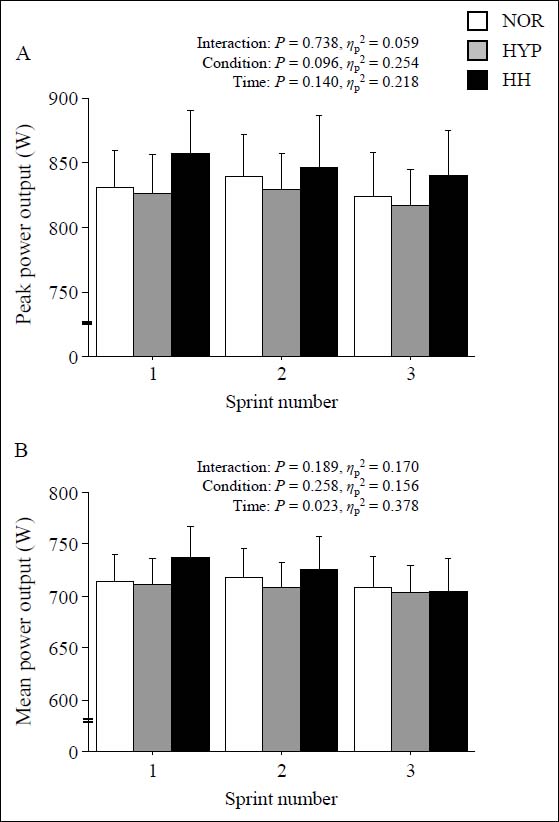
Figure 1.
Peak (A) and mean power outputs (B) during each sprint. Values are means ± standard error of the mean.
|