 |
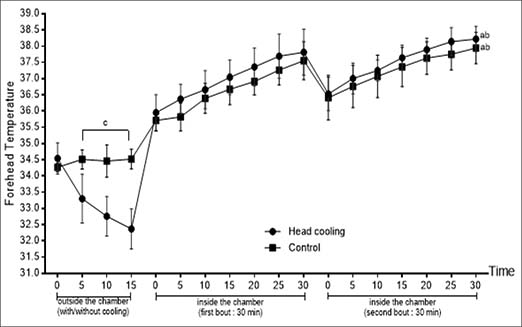
Figure 2.
Forehead temperature (°C) of participants in experimental trials. Mean forehead temperature was lowered in HC trial than CON trial during the precooling session (n=10). “a” indicates a significant main effect for time for both trials (p<0.001). “b” indicates large effect size (HC d = 8.41.71, CON d = 10.38) for both trials over time. “c” indicates a large effect size between trials during cooling (d = 2.12 – 4.4).