 |
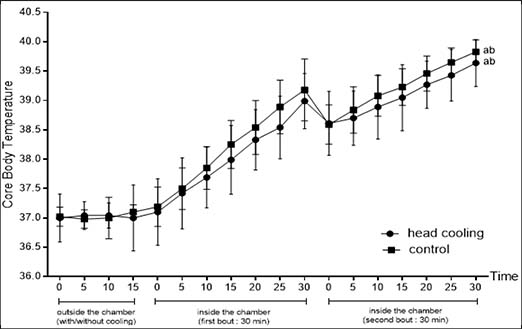
Figure 3.
Core body temperature (°C) of participants during the control and cooling trials (n = 10). “a” indicates a significant main effect for time for both trials (p = 0.01). “b” indicates large effect sizes over time for both CON and HC (d = 15.30, 6.52).