 |
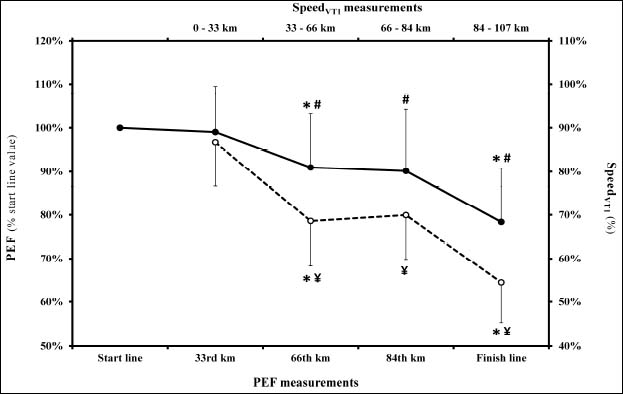
Figure 1.
Time course of peak expiratory flow (PEF, continuous line) and race speed expressed as a percentage of the speed at the first ventilatory threshold in the cardiopulmonary exercise test (SpeedVT1, dotted line). * Significantly different from preceding time point (p < 0.05); # Significantly different from start line value (p < 0.05); ¥ Significantly different from first race section (0-33 km) value (p < 0.05).