 |
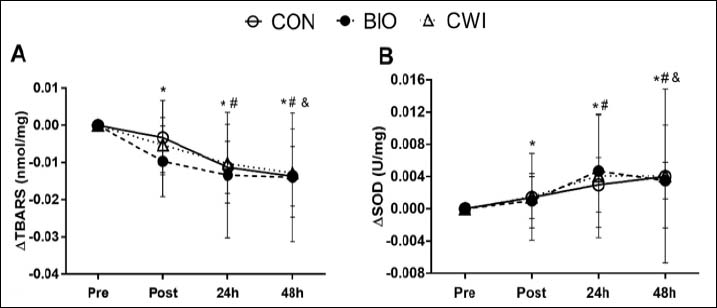
Figure 2.
Delta change from pre for each interventions throughout the 48 h recovery period for (A) TBARS and (B) SOD. * p < 0.05 in relation to pre for all groups; # p < 0.05 in relation to post for all groups; & p < 0.05 in relation to 24-h for all groups. CON: Control group; BIO: Bioceramic group; CWI: cold-water immersion group.