 |
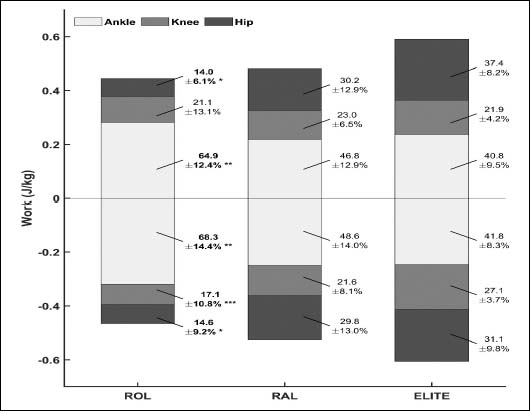
Figure 2.
Positive and negative mean joint work distribution and SD for the ROL, RAL and ELITE. * Indicates that the hip joint work of the ROL is significantly lower (P < 0.016) than the RAL and ELITE. ** Indicates that the ankle joint work of the ROL is significantly higher than the RAL. *** Indicates that the negative knee joint work of the ROL is significantly lower than the ELITE.