 |
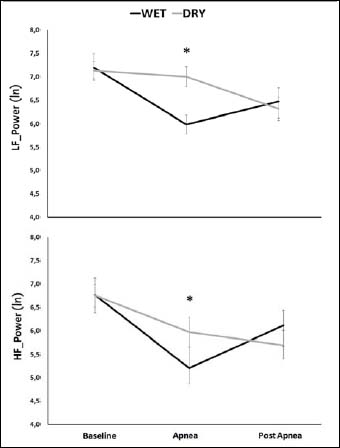
Figure 3.
HRV high- and low-frequency (HF and LF) spectral band (mean ± SD) at baseline, during apnea, and during the post apnea period in WET (black line) and DRY (grey line) condition. Data are log-transformed (ln) (see methods). * represent significant differences between conditions at p < 0.05.