 |
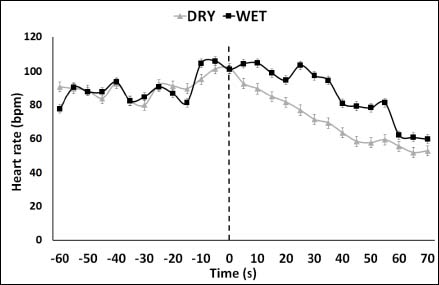
Figure 4.
Heart rate before and during dynamic apneas. Vertical dashed line separates the two phases, preparation (left) and apnea (right). Each point is a 5-s average from 9 athletes. Black squares represent apneas after WET warm-up; grey triangles represent apneas after DRY warm-up.