 |
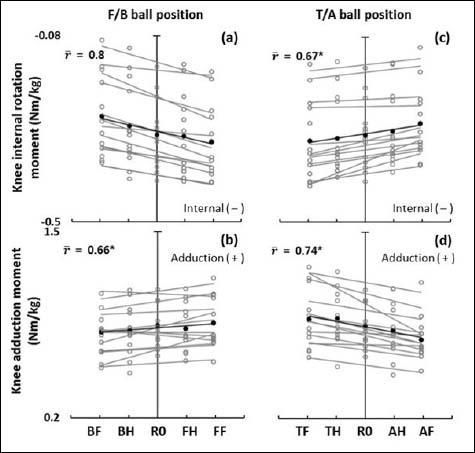
Figure 3.
Overall correlation coefficients r̄) between the peak internal rotation and adduction moments of the lead knee and the forward/backward (F/B) and toward/away from the target (T/A) ball positions. Each grey dot represents the mean value of each participant over five shots. Each dark dot represents the average value across the participants. The horizontal axes show the F/B and T/A ball positions (see Figure 1). * significant at p < 0.0125.