 |
Figure 2.
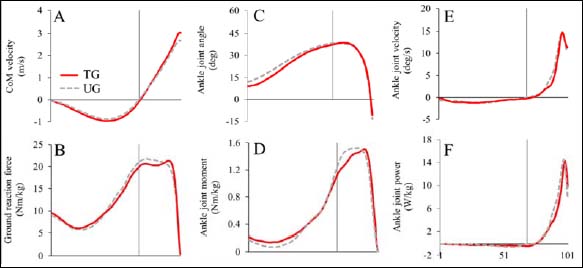
Ankle joint kinematics and kinetics at CMJMax. Jumping data in UG and TG during CMJMax was normalized with 101 from the initial phase to takeoff. A vertical black line represents the propulsion time for each group at CMJMax.
|
|
|
Figure 2.
Ankle joint kinematics and kinetics at CMJMax. Jumping data in UG and TG during CMJMax was normalized with 101 from the initial phase to takeoff. A vertical black line represents the propulsion time for each group at CMJMax.
|