 |
Figure 3.
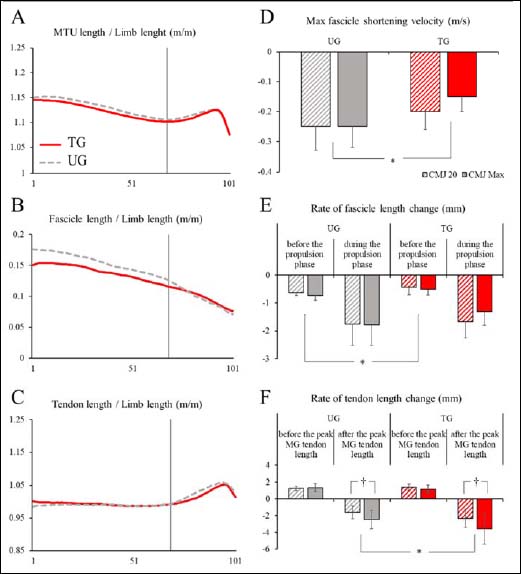
MTU behavior during CMJMAX (A-C) and muscle mechanics during CMJ (D-F). Significantly different at p < 0.05 with groups regardless of trials (*) and tasks regardless of groups († ).
|
|
|
Figure 3.
MTU behavior during CMJMAX (A-C) and muscle mechanics during CMJ (D-F). Significantly different at p < 0.05 with groups regardless of trials (*) and tasks regardless of groups († ).
|