 |
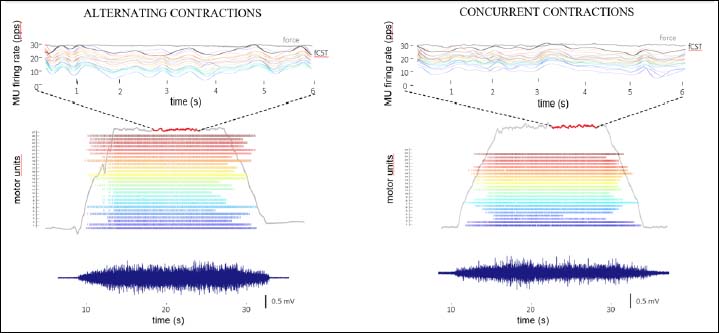
Figure 2.
Representative data depicting the dorsiflexion force during an isometric contraction at 40% MVC force from an athlete trained with alteranting leg actions (left) and an athlete trained with bilateral leg actions (right). Each panel shows (bottom to top traces) the EMG signal for tibialis anterior, the discharge times of multiple MUs (colored tick marks), the force applied by the participant (grey line), and the filtered cumulative spike train (fCST) for each MU and the average trace shown in black.