 |
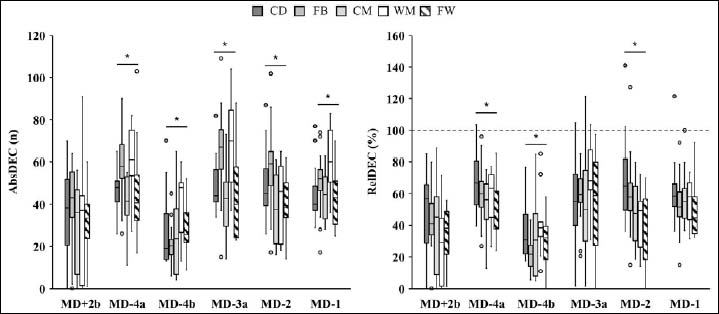
Figure 6.
Whisker plots representing positional absolute and relative decelerations number across the week. Dots represent outliers. *: significant post hoc difference between positions (p < 0.05).
|
|
|
Figure 6.
Whisker plots representing positional absolute and relative decelerations number across the week. Dots represent outliers. *: significant post hoc difference between positions (p < 0.05).
|