 |
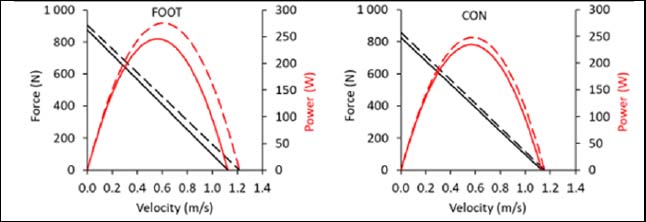
Figure 3.
Leg-extensor force-velocity (black) and power-velocity (red) profile at baseline (solid line) and post intervention (dashed line) in the football training group (FOOT, left) and the control group (CON, right). Error bars were removed to improve visibility of the figure, but can be viewed in Table 3.