 |
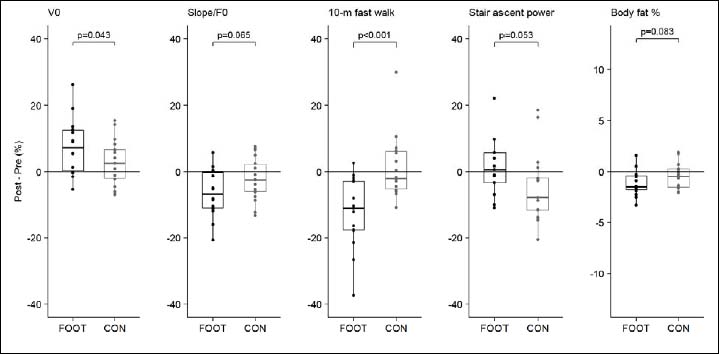
Figure 4.
Boxplots of percent changes from baseline to post intervention for the football training group (FOOT, black) and the control group (CON, grey) for leg-extensor force-velocity variables, functional capacity tests and body fat percentage. P-values of time-by-group interaction effects of linear mixed-effects models were added.