 |
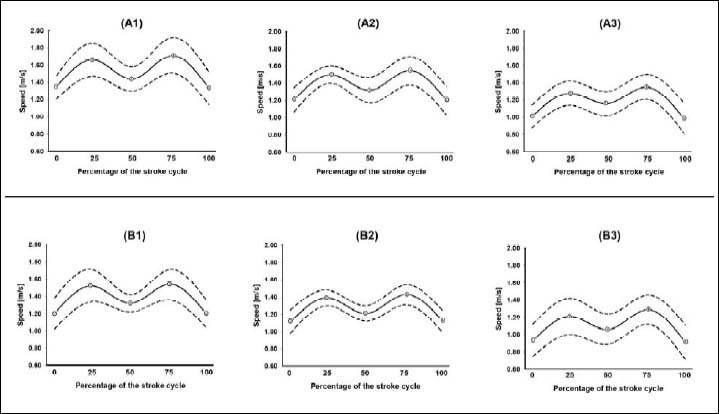
Figure 1.
Speed-time series by sex and tier. Panels A and B depict the average stroke cycle (mean of three stroke cycles) of boys and girls, respectively. Suffix 1 – swimmers included in tier #1 (best performances); Suffix 2 – swimmers included in tier #2 (intermediate performances); Suffix 3 – swimmers included in tier #3 (worst performances). Solid line indicates the mean and dash line the 95% confidence interval. The numbers within the solid line designate time points of key events within front-crawl stroke cycle, specifically: 1 – left hand catch (non-dominant for all individual cases); 2 – transition between the downsweep and insweep of the left upper-limb; 3 – transition between the left upper-limb upsweep and exit, and right-hand catch (dominant for all individual cases); 4 – transition between the downsweep and insweep of the right upper-limb; 5 – transition between the right upper-limb upsweep and exit, and left-hand catch.