 |
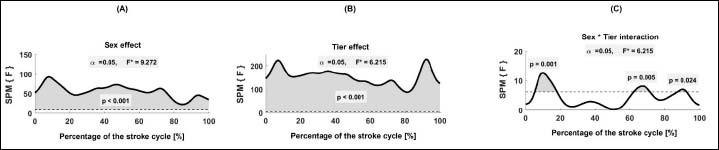
Figure 2.
Main effects computed by SPM. Panel A – sex effect; Panel B – tier effect; Panel C – sex * tier interaction. SPM {F} – ANOVA statistic for a statistical parametric mapping. F – F-ratio; α – significance threshold; p – significance value. Grey area denotes significant differences (p < 0.05) within the speed-time curve. Dash lines represent the 95% confidence intervals (95CI).