 |
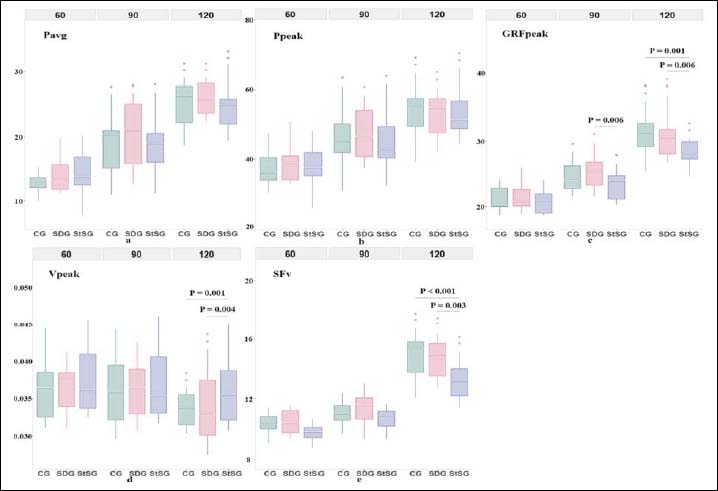
Figure 1.
This illustration presents the average power (Pavg), peak power (Ppeak), peak ground reaction force (GRFpeak), peak center of mass velocity (Vpeak), and force-velocity ratio (SFv) values for the three groups (CG, StSG, and SDG) at three initial knee joint angles (60°, 90°, and 120°). This figure is subdivided into four panels: (a) Pavg, (b) Ppeak, (c) GRFpeak, (d) Vpeak, and (e) SFv. Each box plot within the figure delineates the following characteristics:
Upper edge (Q3): upper quartile; upper whisker: maximum value plus 1.5 times the interquartile range (IQR); central white line: median; lower edge (Q1): lower quartile; lower whisker: minimum value plus 1.5 times the IQR. The significance between different angles within the same group is denoted by asterisks; a single asterisk indicates a significant difference between the 120°, 90°, and 60° angles. The two asterisks denote significant differences between 120°, 90°, and 60°. Horizontal lines with associated P-values represent significant differences among the StSG, SDG, and CG. CG, control group; StSG, static stretching group; SDG, combined static stretching and drop-jump group.
Upper edge (Q3): upper quartile; upper whisker: maximum value plus 1.5 times the interquartile range (IQR); central white line: median; lower edge (Q1): lower quartile; lower whisker: minimum value plus 1.5 times the IQR. The significance between different angles within the same group is denoted by asterisks; a single asterisk indicates a significant difference between the 120°, 90°, and 60° angles. The two asterisks denote significant differences between 120°, 90°, and 60°. Horizontal lines with associated P-values represent significant differences among the StSG, SDG, and CG. CG, control group; StSG, static stretching group; SDG, combined static stretching and drop-jump group.