 |
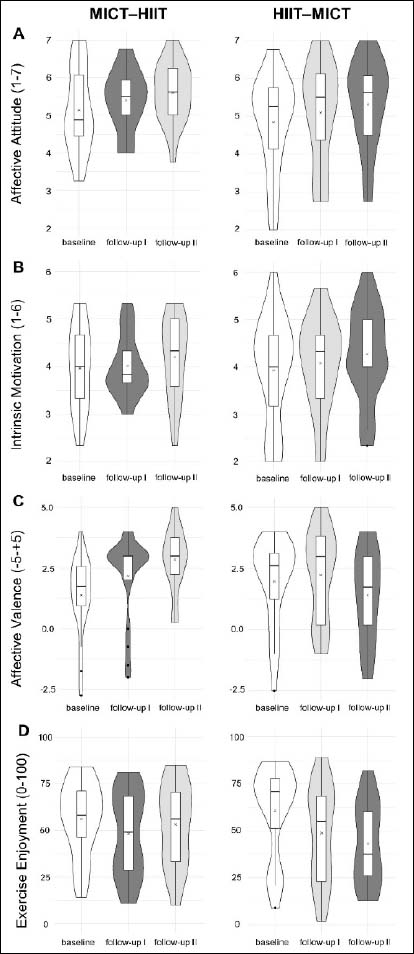
Figure 3.
Violin plots (mirrored estimated kernel density plot on each side of the boxplot, tails are trimmed to the range of the data) to visualize the distribution of affective exercise determinants depending on the type of intervention and treatment sequence. Assessments took place at baseline (white plot: without previous training), at follow-up I and follow-up II (light grey plot: after HIIT; dark grey plot: after MICT). The corresponding descriptive statistics are provided in Supplementary Table 1.