 |
Figure 2.
Distribution of movement cycle distances (m) for males and females coloured by percentile (%) bins.
|
|
|
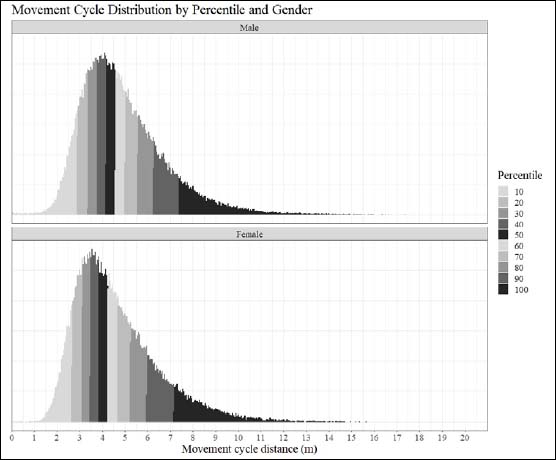
Figure 2.
Distribution of movement cycle distances (m) for males and females coloured by percentile (%) bins.
|