 |
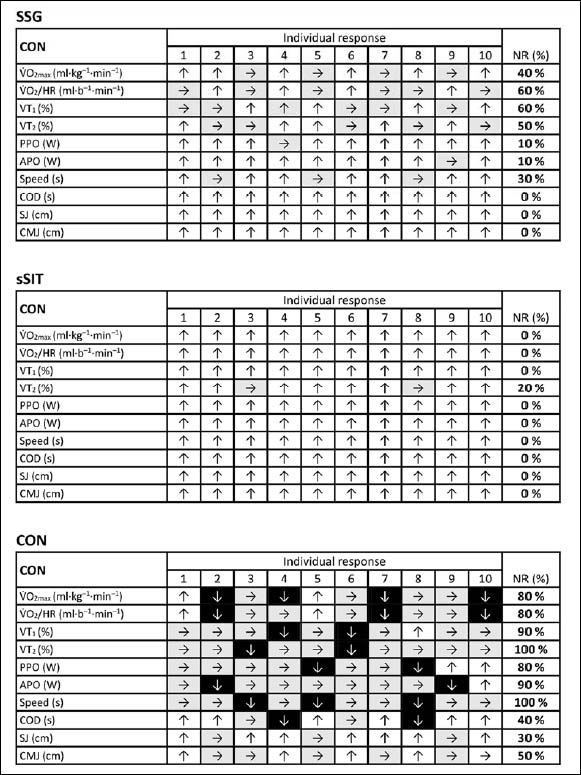
Figure 6.
Individual patterns of response to SSG, sSIT, or CON. ↑ denote responders (white boxes); → denote non-responders (grey boxes), and ↓ indicate adverse responses (black boxes). The percentage of participants demonstrate non-responders including both non- and adverse responses.