 |
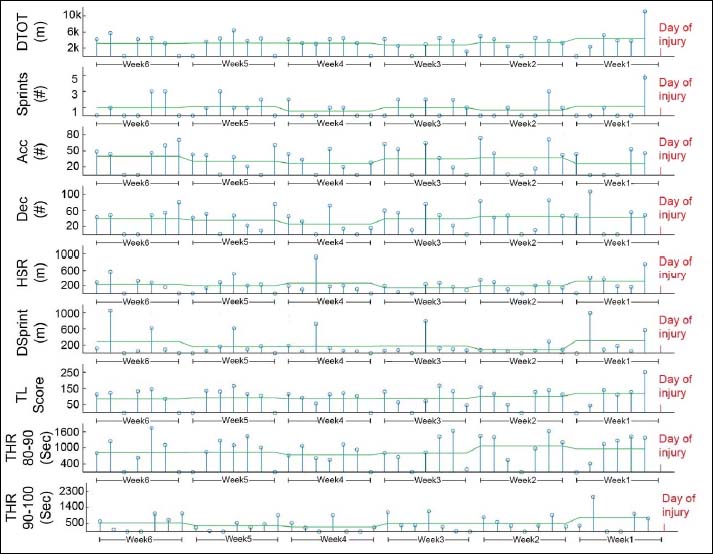
Figure 1.
An indicative example of the recorded metrics for a specific subject for 6 weeks prior to injury occurrence. The fluctuations of the metrics are presented with blue circles and the day of the injury is indicated with red text. The green line demonstrates the average metric per week.