 |
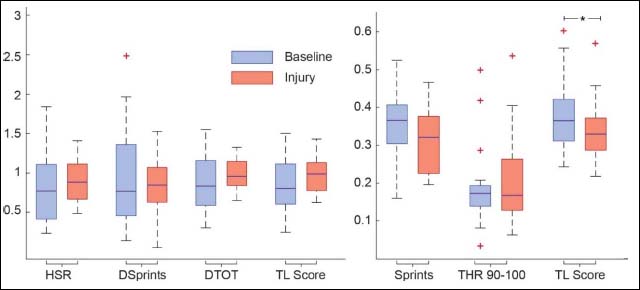
Figure 4.
The variations of the feature values in the two groups (baseline and injury epochs) for ACWR features (left panel) and DEV features (right panel). On each box, the median is indicated by a blue horizontal line, the red cross (+) denotes the outliers, while the whiskers extend to the most extreme data points. Below each box pair, the name of the metric is presented. The star (*) symbol denotes a paired t test p-value <0.05.