 |
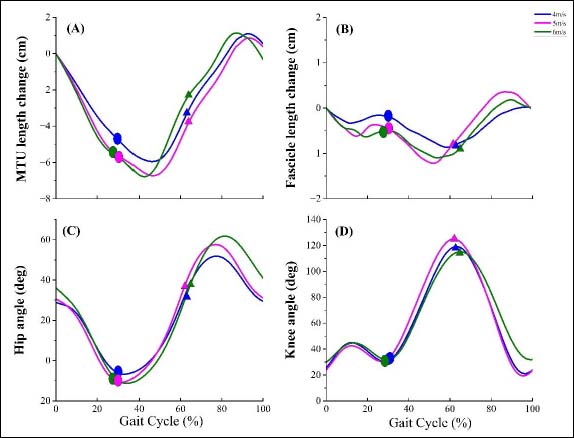
Figure 3.
Group mean curves for the variables assessed during running. Blue, pink, and green lines represent 4m/s, 5m/s, and 6m/s, respectively. Ellipses represent the starting time of the swing phase during different running speeds. Triangles represent the starting time of the late swing phase. The swing phase was defined as the interval from the right toe-off to the right foot strike. The late swing was defined as the interval from the peak knee flexion in the swing phase to the foot strike.