 |
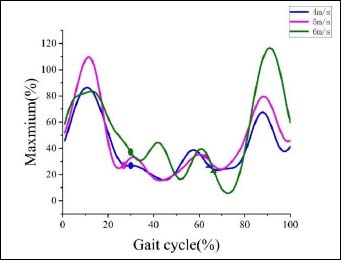
Figure 4.
BFlh muscle linear envelop EMG during a running gait cycle. Blue, pink, and green lines represent 4m/s, 5m/s, and 6m/s, respectively. Ellipses represent the time of toe-off during different running speeds; Triangulars represent the starting time of the late swing phase.