 |
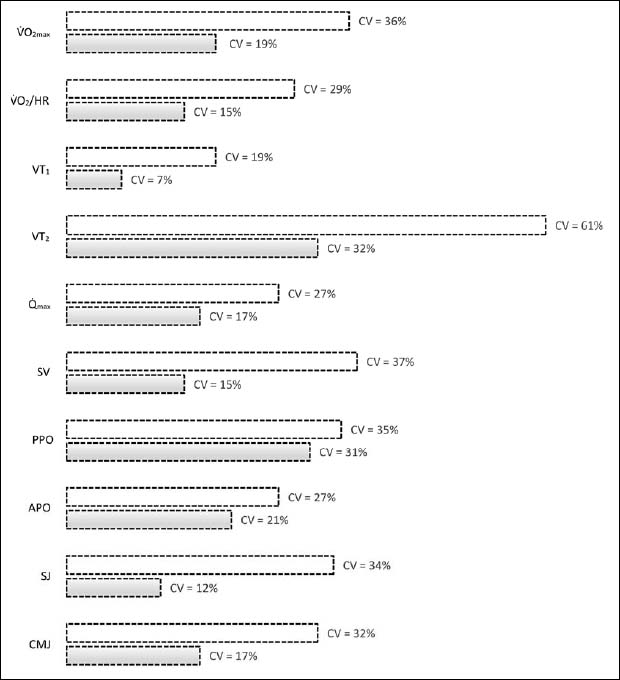
Figure 6.
The inter-individual variation (CV) of percent changes in maximum oxygen uptake (V̇O2max), O2 pulse (V̇O2/HR), first ventilatory threshold (VT1), second ventilatory threshold (VT2), cardiac output (Q̇max), and stroke volume (SV), peak power output (PPO), average power output (APO), squat jump (SJ), and countermovement jump (CMJ) in response to HIITRS (gray bars) and HIITTS (white bars).