 |
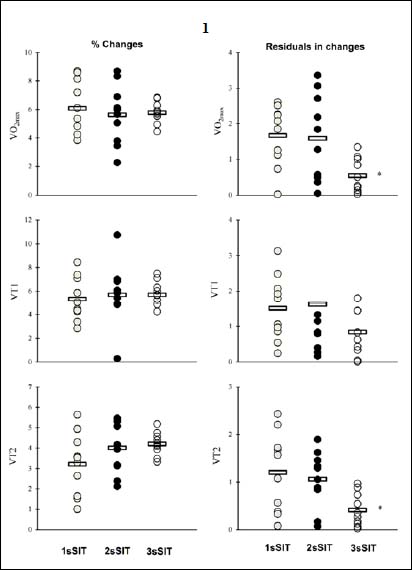
Figure 4.
Individual changes (%) from pre-to post-training and residuals in percent change as the squared root of the squared differences for the 1sSIT, 2sSIT, and 3sSIT groups in maximum oxygen uptake (V̇O2max), first ventilatory threshold (VT1) and second ventilatory threshold (VT2).*denotes significant differences between 3sSIT and other groups (p < 0.05).