 |
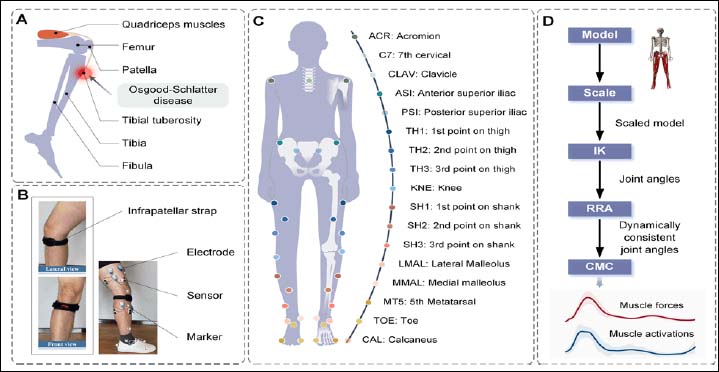
Figure 1.
The common site of Osgood-Schlatter disease, the experimental setup, and flowchart of the inverse dynamic analysis. (A) Lateral view of the knee joint. The red area represents the common site of the Osgood-Schlatter disease. (B) Participants wearing the infrapatellar straps. (C) Position of the Vicon markers in front view. A total of 32 markers were placed; the locations were the shoulder, 7th cervical, clavicle, anterior and posterior superior iliac, thighs, knees, shanks, and feet. (D) The flowchart for inverse dynamic analysis of each participant's motion with OpenSim.