 |
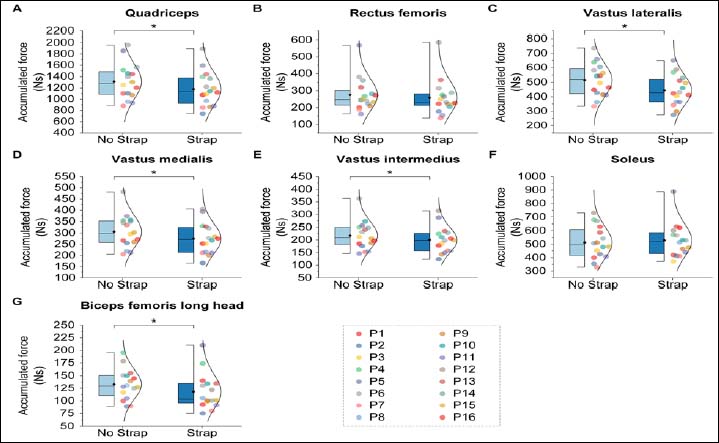
Figure 4.
Accumulated forces of the quadriceps (A), rectus femoris (B), vastus lateralis (C), vastus medialis (D), vastus intermedius (E), soleus (F), and biceps femoris long head (G) under conditions with and without infrapatellar straps. In each box plot, the upper and lower borders of the box represent the upper and lower quartiles. The middle horizontal line represents the median. The upper and lower whiskers represent the maximum and minimum values. The black dot within each box indicates the mean value for each condition. The circular dots with different colors represent the actual values of all participants. The asterisk indicates statistical differences between the two groups where p < 0.05. Ns: Newton·s.