 |
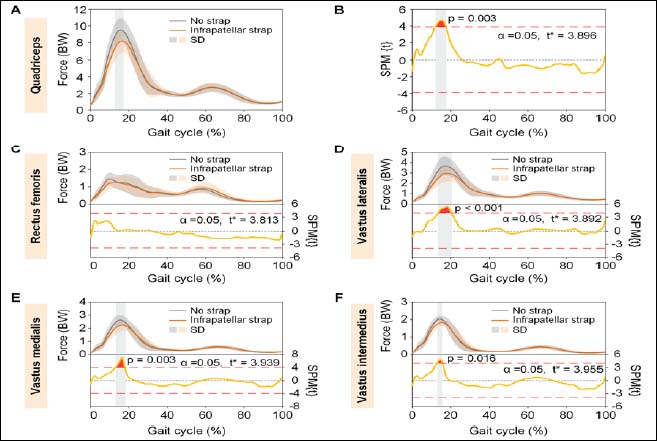
Figure 5.
Muscle forces and results of SPM curves of quadriceps and individual muscles of quadriceps. Muscle forces (A) and results of SPM{t} curves (B) of the quadriceps muscle. Force (top) and SPM{t} (bottom) curves of the rectus femoris (C), vastus lateralis (D), vastus medialis (E), and vastus intermedius (F). The force is described as the mean (solid line) ± standard deviation (shaded area), and it is normalized by the body weight of each participant. The shaded areas on the SPM{t} curve show the track locations where the SPM{t} curve exceeded the critical threshold (red dotted line). The p-values are provided for these suprathreshold clusters. BW: body weight.