 |
Figure 6.
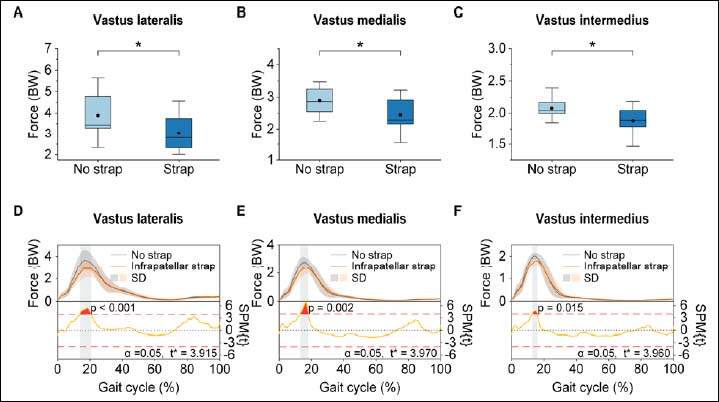
Peak active fiber forces and SPM curve results for the vastus muscles. Peak active fiber forces of the vastus lateralis (A), vastus medialis (B), and vastus intermedius (C). Force (top) and SPM{t} (bottom) curves of the vastus lateralis (D), vastus medialis (E), and vastus intermedius (F). In each box plot, the upper and lower borders of the box represent the upper and lower quartiles. The middle horizontal line represents the median. The upper and lower whiskers represent the maximum and minimum values. The black dot within each box indicates the mean value for each condition. The asterisk indicates statistical differences between the two groups where p < 0.05. The force is described as the mean (solid line) ± standard deviation (shaded area). The shaded areas on the SPM{t} curve show the track locations where the SPM{t} curve exceeded the critical threshold (red dotted line). The force is normalized by the body weight of each participant. The p-values are provided for these suprathreshold clusters. BW: body weight.