 |
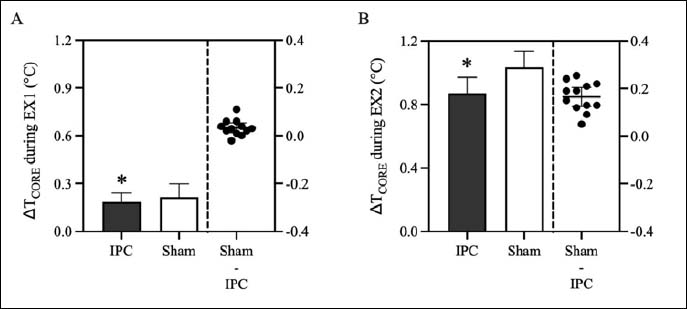
Figure 5.
Core body temperature (TCORE). The changes in TCORE (TCORE) before and after (A) EX1 and (B) EX2 are shown. Scatter plots that present the mean difference in TCORE between the IPC and sham conditions are shown on the right panel of each figure. Data are presented as mean ± SD, n = 12, * P < 0.05 vs. sham.