 |
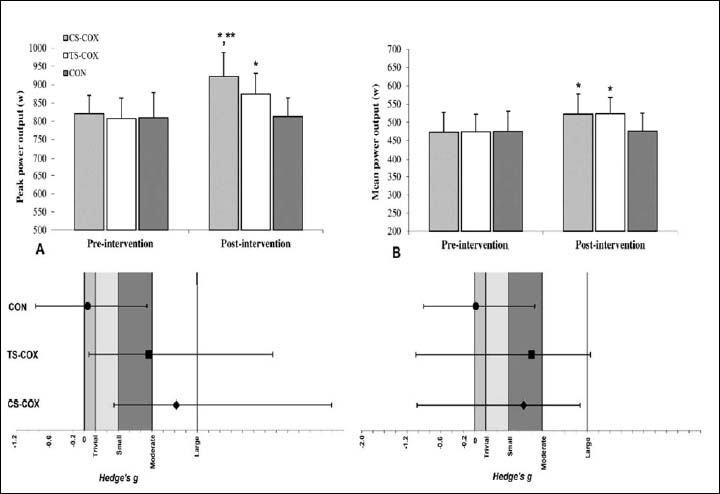
Figure 4.
Pre to post-intervention changes in power performance (mean ± SD). *Significant differences compared with Pre and CON (p < 0.05). **Significant differences compared with TS-COX (p < 0.05). CS-COX: cluster sets complex, TS-COX: traditional sets complex.