 |
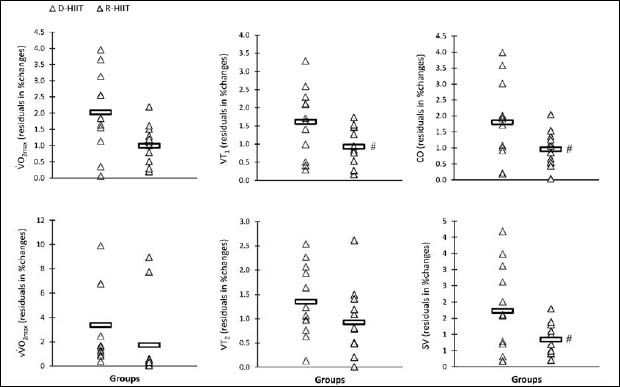
Figure 3.
Residuals in individual changes in response to interval jumping and interval running over the training period in maximum oxygen uptake (V̇O2max), velocity associated to V̇O2max (vV̇O2max), first ventilatory threshold (VT1), second ventilatory threshold (VT2), maximal cardiac output (Q̇max), and stroke volume (SVmax). Individual residuals in percentage change are shown by triangles, and mean group residuals in percentage change is shown by horizontal bars. # Significantly lower residuals in individual changes than interval jumping.