 |
Figure 6.
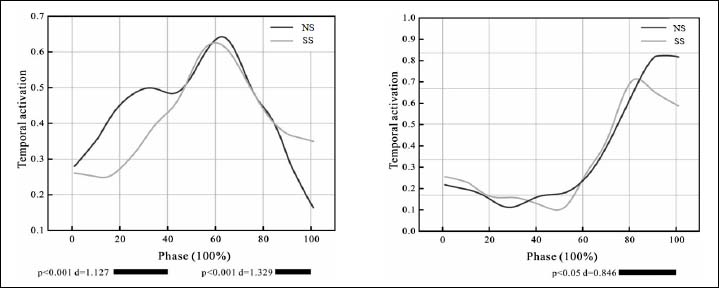
Results of SPM t-tests for temporal activation features in both modalities (H1H2) for SS and NS. Black shaded areas represent significant differences.
|
|
|
Figure 6.
Results of SPM t-tests for temporal activation features in both modalities (H1H2) for SS and NS. Black shaded areas represent significant differences.
|