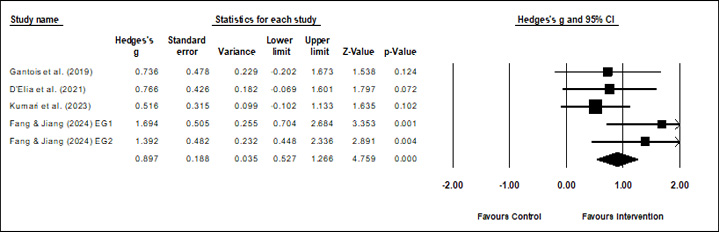
Figure 5.
Forest plot of HIIT on VO
2
max value.