 |
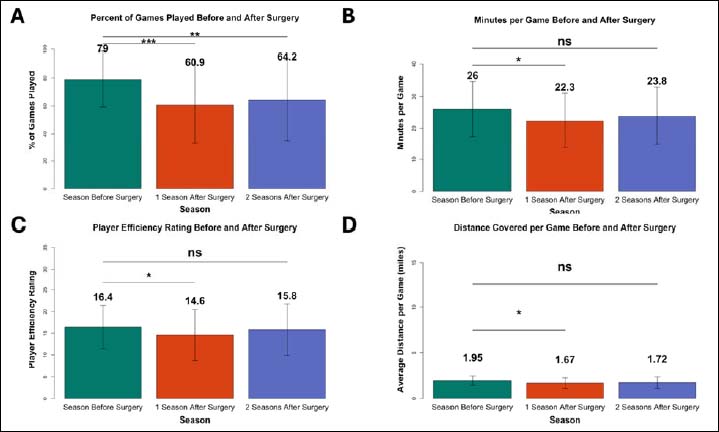
Figure 3.
Postoperative availability and performance outcomes. The paired t-test compares A) the percentage of games played, B) the minutes per game, C) the player efficiency rating, and D) the distance covered per game preoperative season versus one- and two-year postoperatively. * p < 0.05, ** p < 0.01, *** p < 0.001.