 |
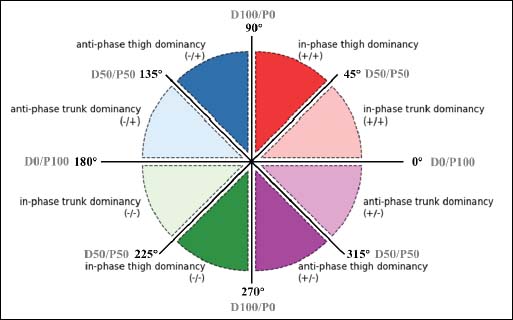
Figure 3.
A classification of coordination patterns based on coupling angles. Different colour partitions represent different coordination patterns (black), and segment dominance (grey) is marked around the circumference of the disk graph (D = distal, P = proximal).