 |
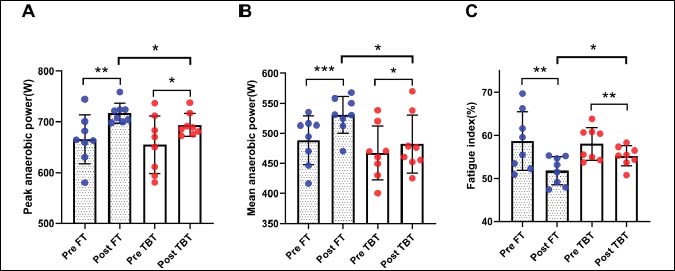
Figure 1.
The graphs compare the pre- and post-intervention anaerobic capacity within the flywheel eccentric training and traditional barbell training groups, respectively, as well as the post-experimental significance of the two groups. Flywheel eccentric training is shown in blue and traditional barbell training in red, with each point corresponding to an individual athlete. Panel A is the peak anaerobic power, Panel B is the mean anaerobic power, and Panel C is the fatigue index. Data are presented as means ± standard deviation (M ± SD).