 |
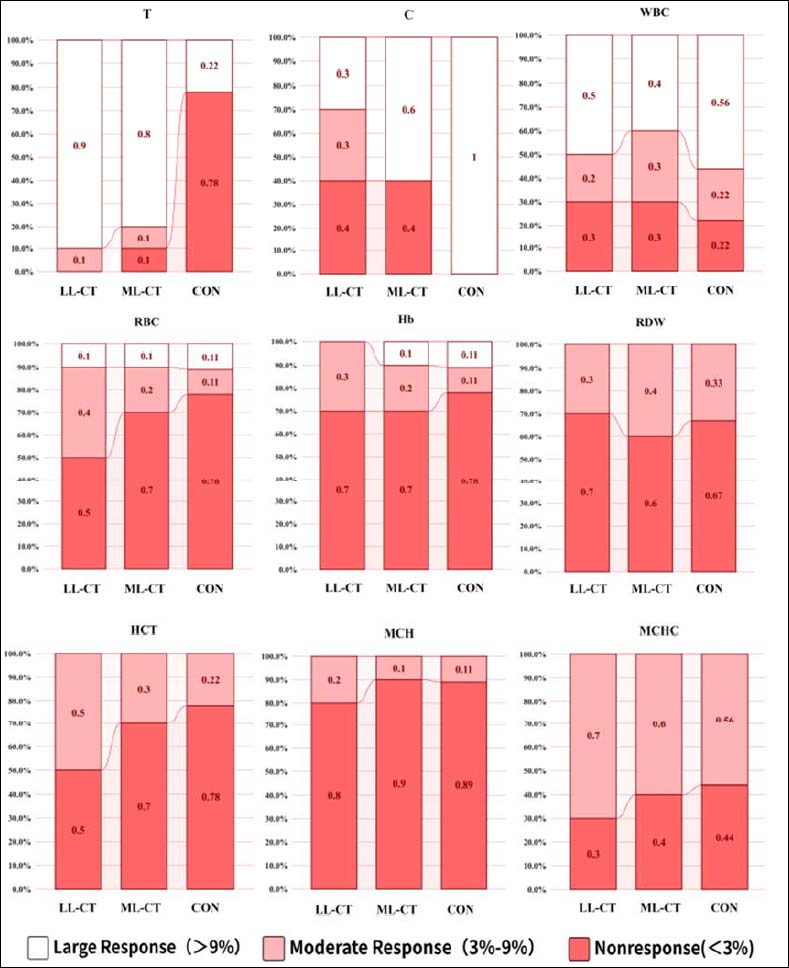
Figure 3.
Proportional distribution of individual response magnitudes (pre–post) across groups. Each stacked bar totals 100% and represents the proportion of participants in three response categories based on percent change from pre to post: red = non-response (<3%), pink = moderate response (3–9%), white = large response (>9%).