 |
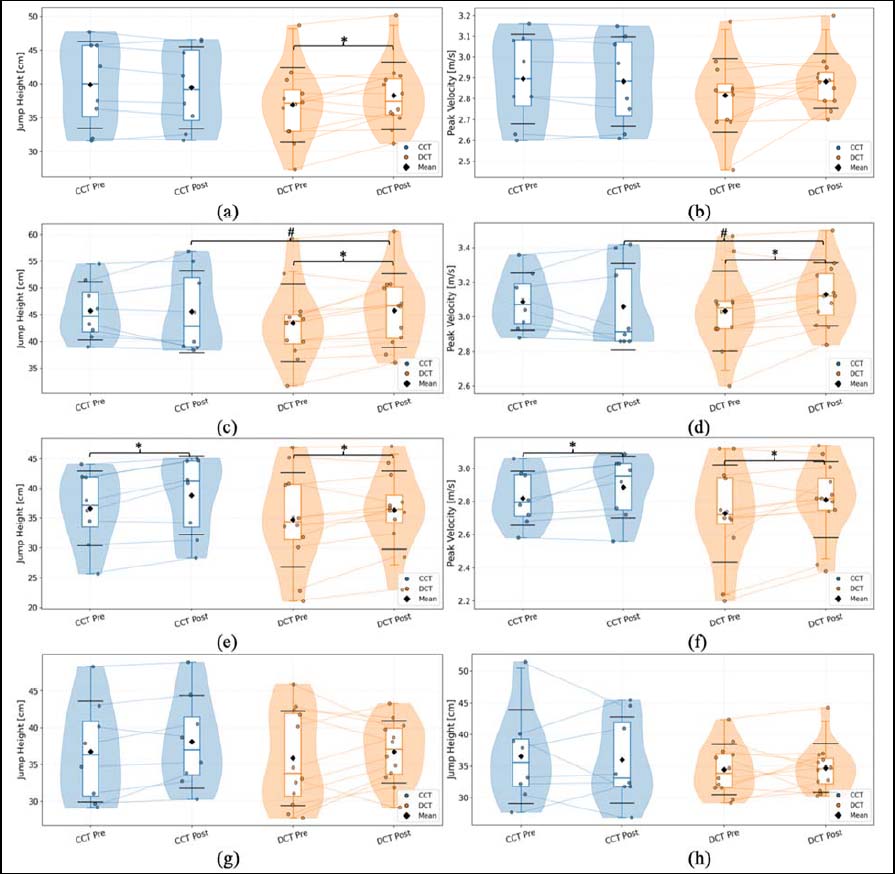
Figure 3.
Individual pre- and post-changes, violin-based data distributions, box-and-whisker representations (median and interquartile range), and mean values (black diamond markers) with standard deviations (horizontal standard deviation lines) across eight jumping performance variables. Panels illustrate: (a) jump height and (b) peak velocity in the countermovement jump; (c) jump height and (d) peak velocity in the countermovement jump with arm swing; (e) jump height and (f) peak velocity in the squat jump; (g) jump height in the drop jump from 40 cm; and (h) jump height in the drop jump from 60 cm. ACT - ascending complex training group; DCT - descending complex training group. * indicates a statistically significant within-group difference between pre- and post-intervention values; # indicates a statistically significant between-group difference in the change scores (post–pre).