 |
Figure 4.
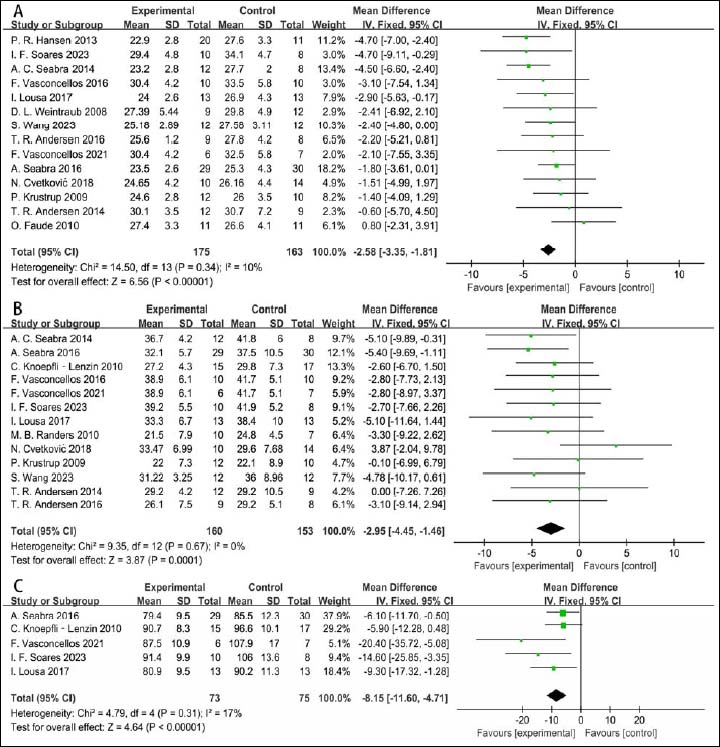
Forest plot showing the comparison of (A) BMI; (B) BFP; and (C) WC between the intervention and control groups.
|
|
|
Figure 4.
Forest plot showing the comparison of (A) BMI; (B) BFP; and (C) WC between the intervention and control groups.
|