 |
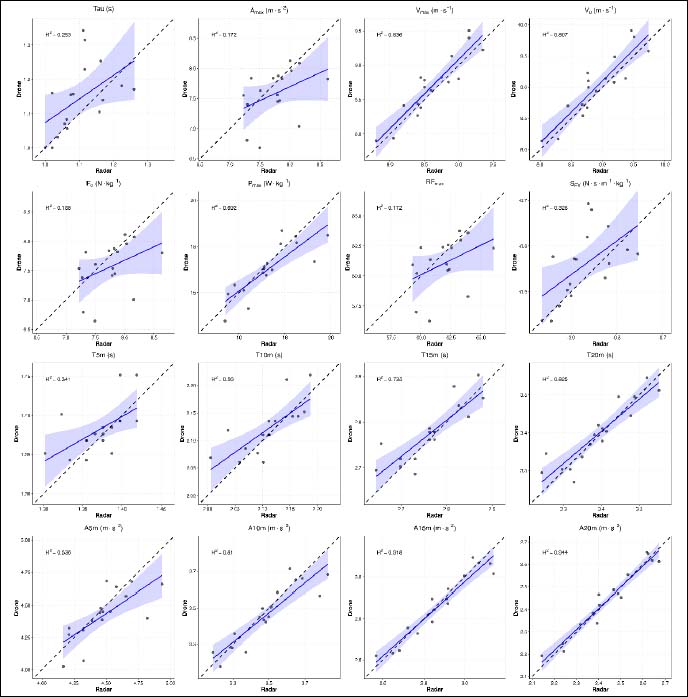
Figure 4.
Scatter plots with lines of identity comparing sprint mechanical variables derived from the drone and radar systems. The dashed black line represents the line of perfect agreement (y = x), while the solid blue line indicates the linear regression fit along with its 95% confidence intervals.