 |
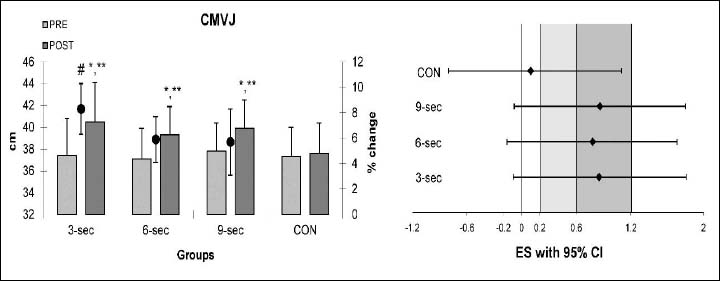
Figure 1.
Pre to post-intervention changes in the CMVJ (mean ± SD) and ES with 95% CI. * Significant differences compared with Pre (p < 0.05). ** Significant differences compared with CON group (p < 0.05). # Significant differences compared with 9-sec group (p < 0.05).