 |
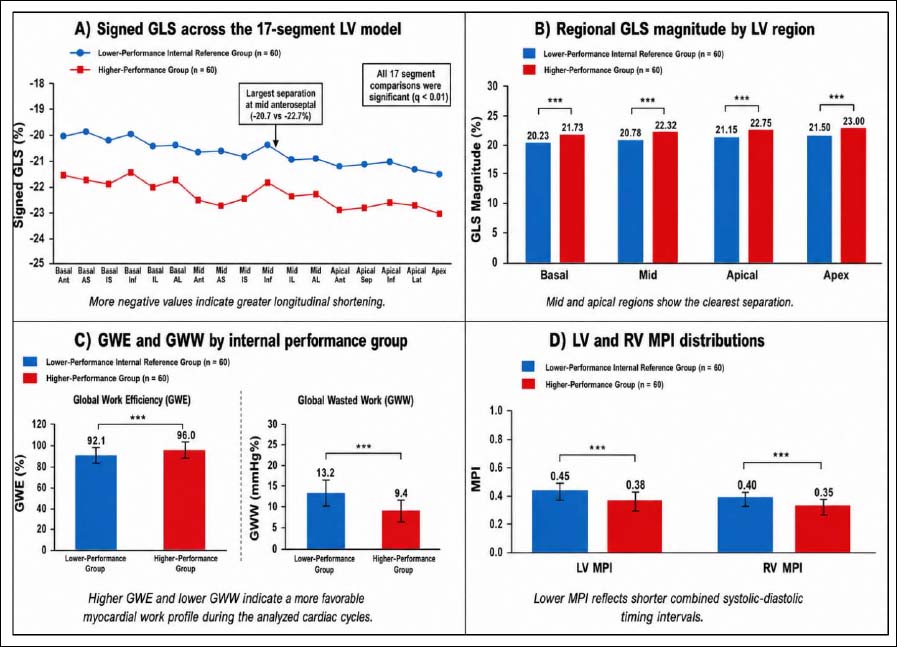
Figure 3.
A) Signed GLS values across the 17-segment LV model in the lower-performance internal reference group and higher-performance group; B) GLS magnitude by LV region; C) GWE and GWW distributions by internal performance group; D) LV MPI and RV MPI distributions by internal performance group.