 |
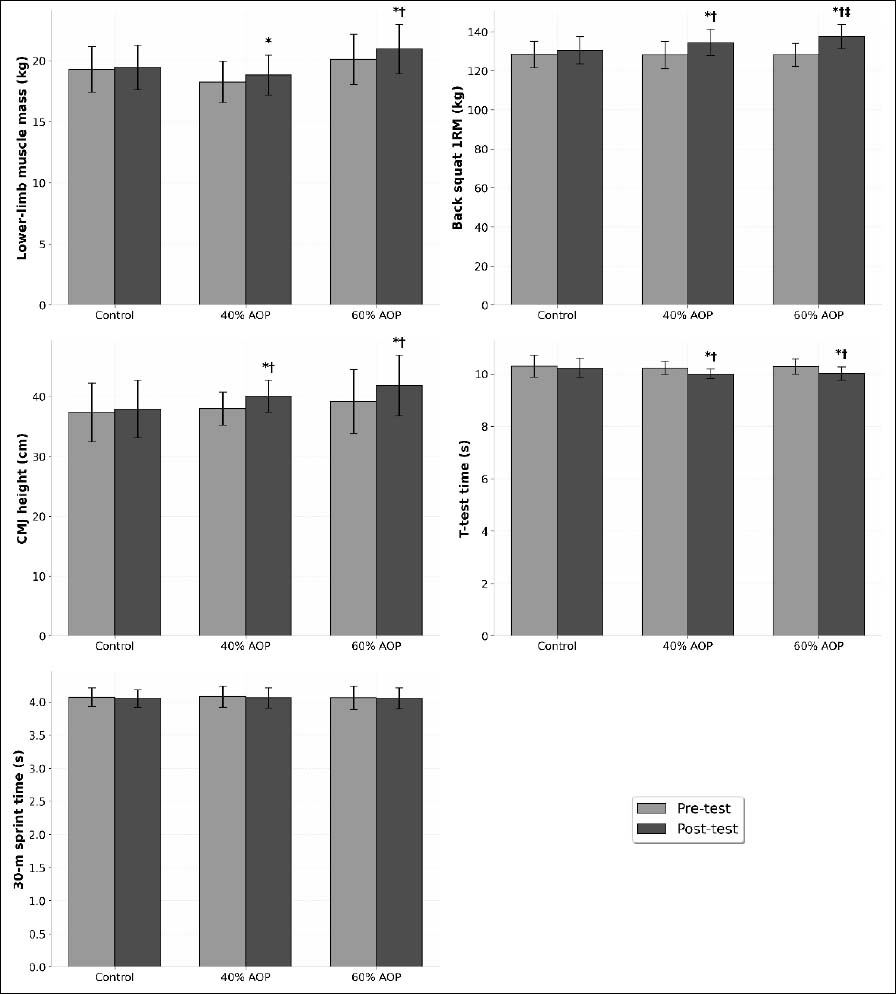
Figure 2.
Changes in primary outcomes before and after the intervention. *Significant difference compared with pre-test (P < 0.05). †Significantly greater than the control group at post-test (P < 0.05). ‡Significantly greater than the 40% AOP group at post-test (P < 0.05).