 |
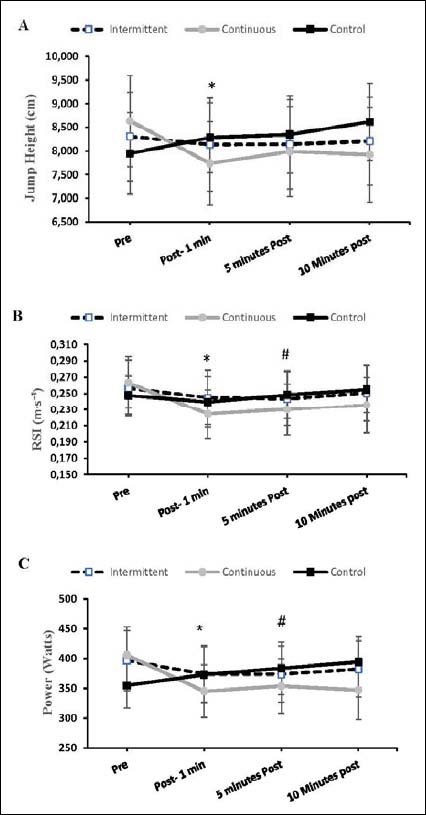
Figure 1.
Changes in non-dominant leg neuromuscular performance across sessions and time points. (A) Hop Height; (B) Reactive Strength Index (RSI: (m·s-1;)); (C) Power (Watts). The asterisk indicates that during the continuous session, hop height (p = 0.048), RSI (p = 0.003), and power (p < 0.001) were significantly lower 1 min after exercise compared with pre-exercise values. Hashtag illustrates that RSI (p = 0.03) and power (p = 0.008) remained significantly suppressed at 5 min post-exercise compared to 1 min post-exercise. Values are presented as mean SEM.