 |
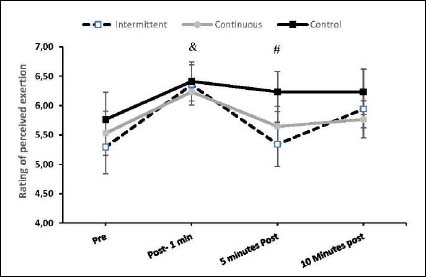
Figure 2.
Mean (± SEM) the upper body Rating of perceived exertion across sessions and time points. Ampersand (&) indicates that RPE was significantly higher 1 min post-exercise compared with pre-exercise (p = 0.004). Hashtag (#) illustrates that RPE was significantly lower at pre-exercise (p = 0.017) and 5 min post-exercise (p = 0.008) compared with 1 min after exercise.