 |
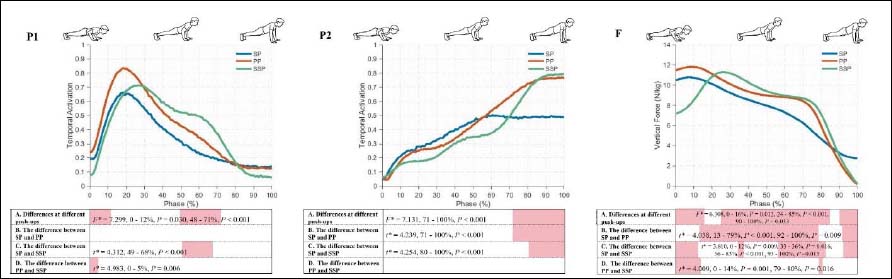
Figure 5.
– Temporal Differences in Synergy Primitives and Vertical Force (SPM). P1, synergy primitive 1; P2, synergy primitive 2; F, vertical ground reaction force; SP, standard push-up; PP, plyometric push-up; SSP, standard squat push-up. Line plots show the mean temporal activation patterns of synergy primitives (P1 and P2) and the vertical ground reaction force (F) across 0–100% of the concentric phase. Shaded regions indicate time intervals with significant differences identified by one-dimensional statistical parametric mapping (SPM), with corresponding F* or t* statistics and P values reported.